Statistics
The Statistics window shows detailed data about the current aMule session: speed graphs, transfer totals, connection metrics, client population, and server statistics.
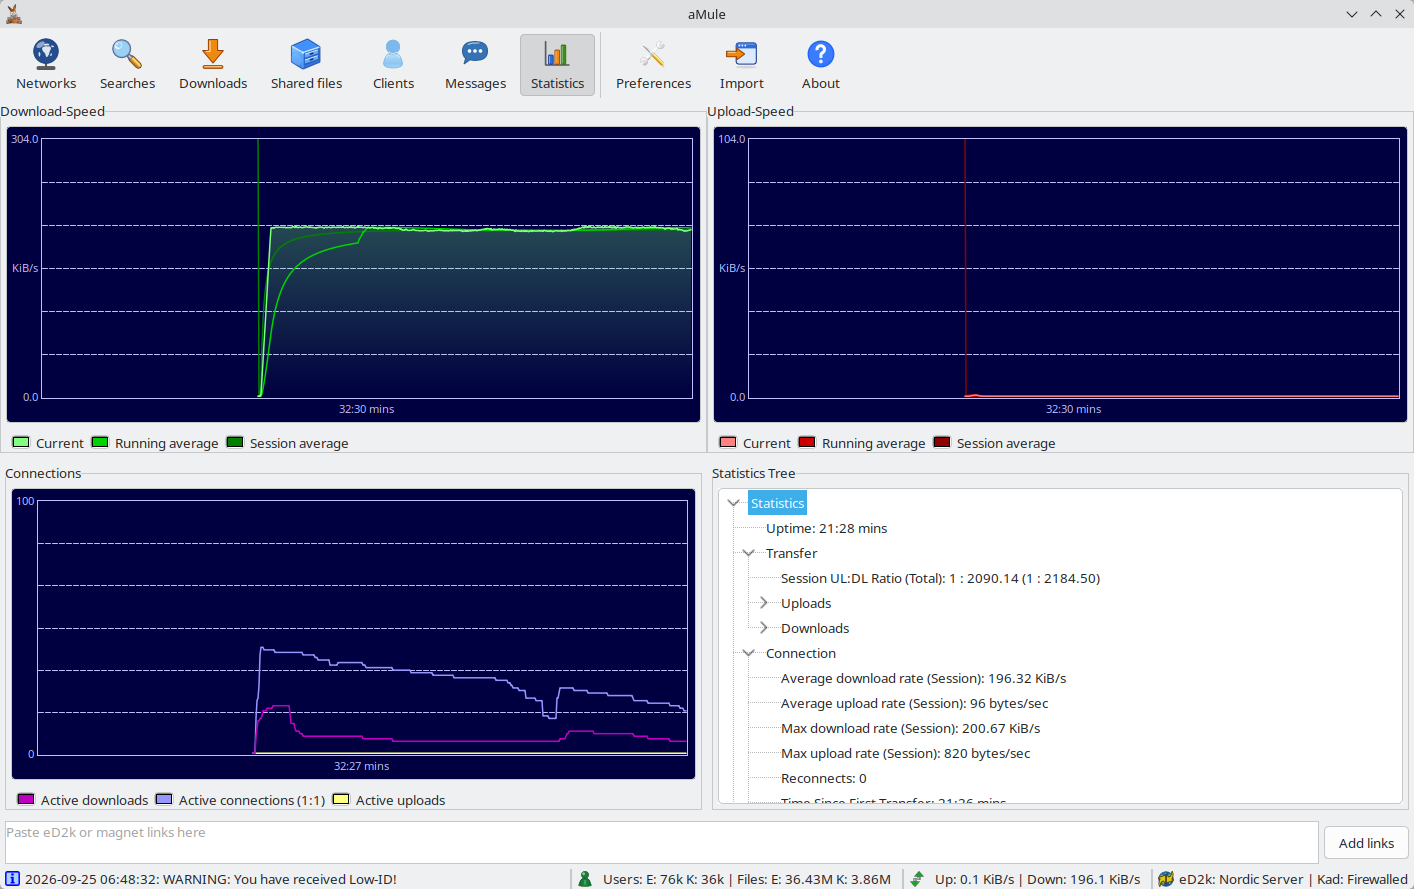
The window is divided into two main areas:
- Graphs — download speed (top left), upload speed (top right) and connections (bottom left): visual history for the last few minutes.
- Statistics tree (bottom right) — a hierarchical breakdown of all numeric statistics.
Graphs
The three graphs each update in real time.
Make sure you understand how to read the graphs: the X axis represents time (newest data on the right), and the Y axis is the measured value. The "average" lines smooth out short-term spikes.
Each graph has a legend below it with three labelled colour swatches identifying its lines. The curves are drawn anti-aliased, and the Current curve of every graph except Connections has a shaded fill underneath. The speed graphs are scaled in KiB/s. The colours can be changed in Preferences → Statistics.
Reading a Value
Hover the mouse over a graph to read its exact values: a vertical crosshair snaps to the nearest sample, a marker highlights each line at that point, and a box shows how far back the sample is (for example -2:30 mins) followed by the value of each line with its colour. Speeds are shown in the most readable unit, e.g. 2.13 MiB/s. The Kad nodes graph in the Networks window works the same way.
In amulegui the graphs show the history kept by the connected core, so they are already filled when the remote GUI connects and stay filled when you switch tabs.
Download Speed
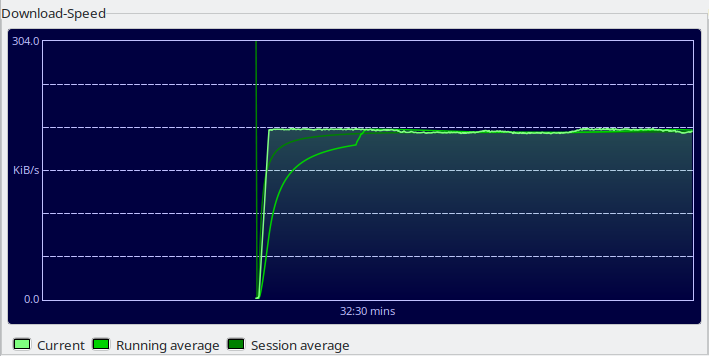
The top-left graph shows download speed over recent minutes:
| Legend | Colour | Meaning |
|---|---|---|
| Current | Light green | Current download speed |
| Running average | Medium green | Average download speed over the last X minutes (configured in Preferences → Statistics → Time for average graph) |
| Session average | Dark green | Average download speed since aMule was started |
Upload Speed
The top-right graph shows upload speed:

| Legend | Colour | Meaning |
|---|---|---|
| Current | Light red | Current upload speed |
| Running average | Medium red | Average upload speed over the last X minutes |
| Session average | Dark red | Average upload speed since aMule was started |
Connections
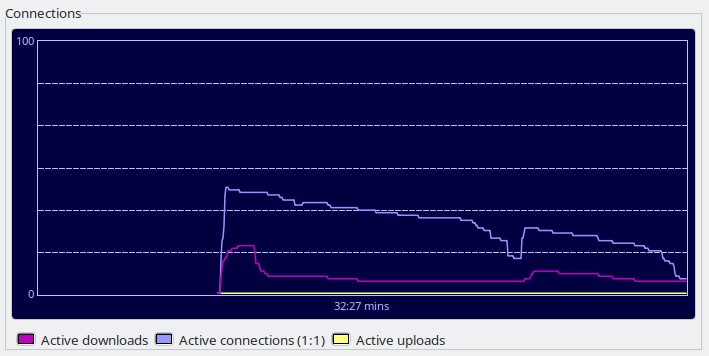
The bottom-left graph shows the number of active connections:
| Legend | Colour | Meaning |
|---|---|---|
| Active downloads | Magenta | Connections actively downloading (clients uploading to you) |
| Active connections | Lavender | All active connections combined |
| Active uploads | Yellow | Connections actively uploading (you uploading to clients) |
The Active connections legend label includes a scale factor such as (1:3). This is the vertical (Y axis) scale of the graph, not a usage ratio: it indicates the axis has been scaled 3× because the peak number of connections exceeded the configured graph scale (Preferences → Statistics → Connections Graph Scale, default 100). The label stays at (1:1) until the peak rises above that scale.
Statistics Tree
The bottom-right panel contains a hierarchical tree of detailed statistics.
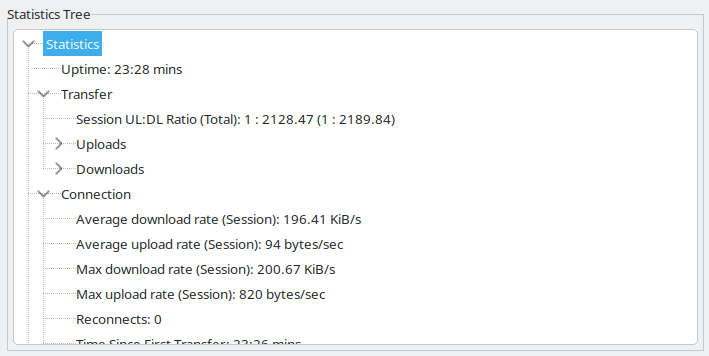
Items whose value is not yet known may be hidden until a valid value is available.
Statistics
| Item | Description |
|---|---|
| Uptime | How long aMule has been running |
Transfer
The Transfer branch lists the session ratio first, then the Uploads and Downloads sub-trees.
Session UL:DL Ratio (Total)
| Item | Description |
|---|---|
| Session UL:DL Ratio (Total) | Normalized upload-to-download ratio for the session (the smaller side reduced to 1), with the all-time ratio in brackets. Shows "Not available" until data has been transferred in both directions |
Uploads
| Item | Description |
|---|---|
| Uploaded Data (Session (Total)) | Data uploaded this session; all-time total in brackets |
| (client list) | Per-client-application breakdown of uploaded data |
| Total Overhead (Packets) | Combined control-packet overhead (sum of the four types below). Shown as bytes with the packet count in brackets |
| File Request Overhead (Packets) | Bandwidth used by file-request control packets |
| Source Exchange Overhead (Packets) | Bandwidth used by source-exchange control packets |
| Server Overhead (Packets) | Bandwidth used by server communication control packets |
| Kad Overhead (Packets) | Bandwidth used by Kademlia communication control packets |
| Crypt overhead (UDP) | Bandwidth used by protocol obfuscation on UDP packets |
| Active Uploads | Number of clients you are currently uploading to (upload slots in use) |
| Waiting Uploads | Number of clients currently in your upload queue |
| Total successful upload sessions | Finished uploads this session that transferred at least one byte to the client |
| Total failed upload sessions | Finished uploads this session that ended without transferring any data |
| Average upload time | Average duration of a successful upload (time a client spent in your upload slot) |
Downloads
| Item | Description |
|---|---|
| Downloaded Data (Session (Total)) | Data downloaded this session; all-time total in brackets |
| (client list) | Per-client-application breakdown of downloaded data |
| Total Overhead (Packets) | Combined control-packet overhead (sum of the four types below). Shown as bytes with the packet count in brackets |
| File Request Overhead (Packets) | Bandwidth used by download file-request control packets |
| Source Exchange Overhead (Packets) | Bandwidth used by download source-exchange control packets |
| Server Overhead (Packets) | Bandwidth used by download server communication control packets |
| Kad Overhead (Packets) | Bandwidth used by Kademlia communication control packets |
| Crypt overhead (UDP) | Bandwidth used by protocol obfuscation on UDP packets |
| Found Sources | Total sources found this session, broken down by origin (sub-tree below) |
| Active Downloads (chunks) | Number of clients currently uploading to you (sources in the downloading state) |
The Found Sources item expands into a sub-tree counting sources by origin (each origin also shows its share of the total as a percentage):
| Origin | Description |
|---|---|
| Local Server | Sources found through the server you are connected to |
| Remote Server | Sources found through a server other than the one you are connected to |
| Kad | Sources found through the Kademlia network |
| Source Exchange | Sources found through source exchange |
| Passive | Sources found passively |
| Link | Sources found from an eD2k link |
| Source Seeds | Sources found from saved source seeds |
| Search Result | Sources found from a search result |
| Unknown | Sources found through unclassified methods |
Connection
| Item | Description |
|---|---|
| Average download rate (Session) | Average download speed this session |
| Average upload rate (Session) | Average upload speed this session |
| Max download rate (Session) | Peak download speed this session |
| Max upload rate (Session) | Peak upload speed this session |
| Reconnects | Number of successful server connections minus one (i.e., number of reconnections) |
| Time Since First Transfer | Time elapsed since the first transfer (upload or download) began this session |
| Connected To Server Since | Time elapsed since the last successful server connection; 0 if disconnected |
| Active Connections (estimate) | Estimated number of currently open connections (based on the open socket count) |
| Max Connection Limit Reached | How many times the connection limit (set in Preferences → Connection) was reached, with the date/time it last happened. Shows "Never" if it has not occurred |
| Average Connections (estimate) | Running average of the number of open connections during the session |
| Peak Connections (estimate) | Highest number of simultaneous open connections reached this session |
Clients
| Item | Description |
|---|---|
| Unknown | Clients whose application is unknown |
| Filtered | Clients rejected by the IP filter |
| Banned | Clients currently banned |
| Kad banned addresses | Number of addresses banned by Kad node protection. Only present in builds compiled with Kad node protection, which is off by default |
| Total / Known | Total number of clients and how many of them are of a known application |
| (per-application list) | Number of clients per application (aMule, eMule, etc.), sorted by popularity. Percentage of total shown in brackets |
| (per-version list) | Number of clients per version per application. aMule, Hydranode and MLDonkey also break down into Version and Operating System sub-trees |
Servers
These counters summarise the eD2k server list managed in the Networks window.
| Item | Description |
|---|---|
| Working Servers | Number of servers known to be online |
| Failed Servers | Number of servers that could not be reached |
| Total | Total known servers |
| Deleted Servers | Servers deleted this session |
| Filtered Servers | Servers filtered by the IP filter |
| Users on Working Servers | Sum of users connected to all known working servers |
| Files on Working Servers | Sum of files available through all known working servers |
| Total Users | Sum of users connected to all known servers |
| Total Files | Sum of files available through all known servers (including non-working ones) |
| Server Occupation | Percentage of maximum server capacity currently occupied by connected clients |
Shared Files
These figures summarise your Shared Files list.
| Item | Description |
|---|---|
| Number of Shared Files | Total number of files you are sharing |
| Total size of Shared Files | Combined size of all shared files |
| Average file size | Average size of your shared files |